
- cross-posted to:
- dataisbeautiful@lemmy.world
- cross-posted to:
- dataisbeautiful@lemmy.world
cross-posted from: https://lemmy.zip/post/64948008
You must log in or register to comment.
Without North America the percentage goes all the way down to ~35.6%. That’s some heavy lifting.
They did use a weighted mean (by people × distance travelled?), so the result without NA likely isn’t 35.6 %, but I agree with your statement. (The arithmetic mean of the “world” would be ~45.4 %)
Africans don’t seem to get around
Indeed. At least the source PDF (cited in the graphic) has the data:
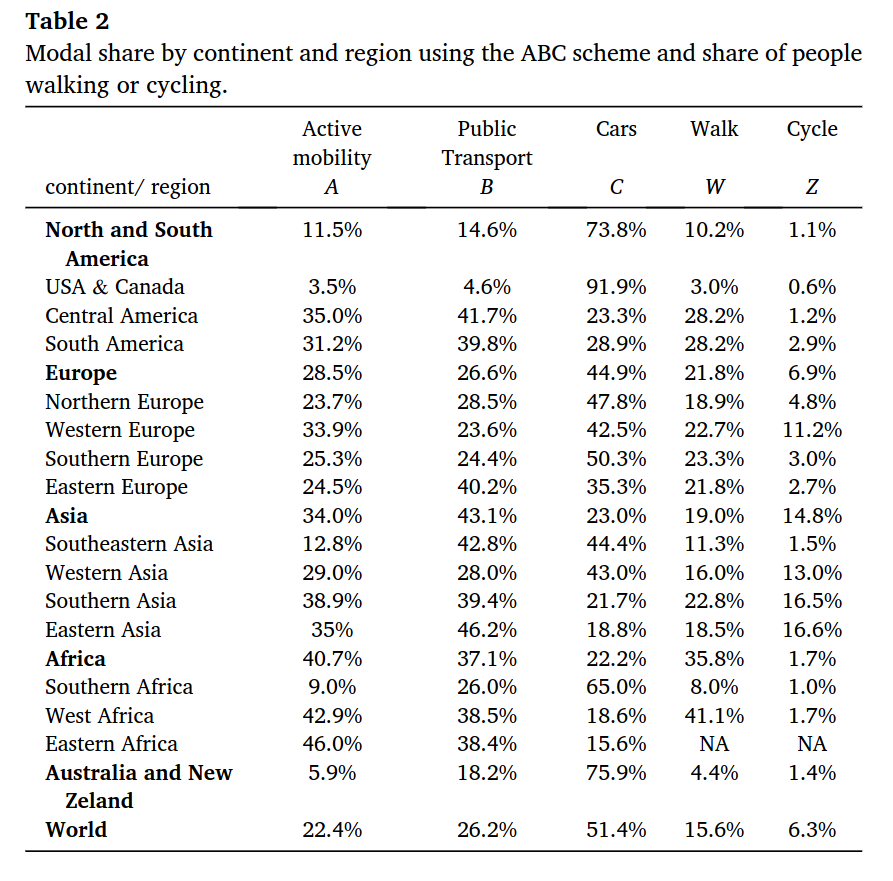
I suppose Mexico is included in “Central America”, the source doesn’t specify. Anyway, if anyone’s interested here’s the link to the source.
why the fuck would op post an image instead of a link to this study?
US, Canada, Australia, Southern Africa, and New Zealand are just sad. They’re car hellscapes.
In the West, Western Europe looks great.
Love the Southern & Eastern Asia ones though.
southeast asia: car 44%
And Malaysia alone bump that number up.
Removed by mod
You mean another highway in KL, because we have plenty here for everyone, and people demanding more 💀
but north AmerIcA iS biGGeR ThAN aSIaaaaa
North Americans are throwing off the curve
Central Europe doesn’t get around
Computer, overlay this data on top of global obesity data.
And we’re surprised the strongest blue zones are in Asia…